Stress Test Envelope
This widget measures the behavior of the portfolio under various shocks of an exogenous index. Use it to gauge expected P&L as well as low-probability, high-impact P&L across a range of shock magnitudes — making it particularly useful for identifying non-linearities and correlation breakdown risks during extreme events.
Widget Components
| Axis / Element | Description |
|---|---|
| X-axis | Shock magnitudes for the exogenous index |
| Y-axis | Portfolio P&L as a percentage of portfolio equity |
| Yellow line | Expected P&L at each shock level |
| Blue area | Tail P&L range at each shock level |
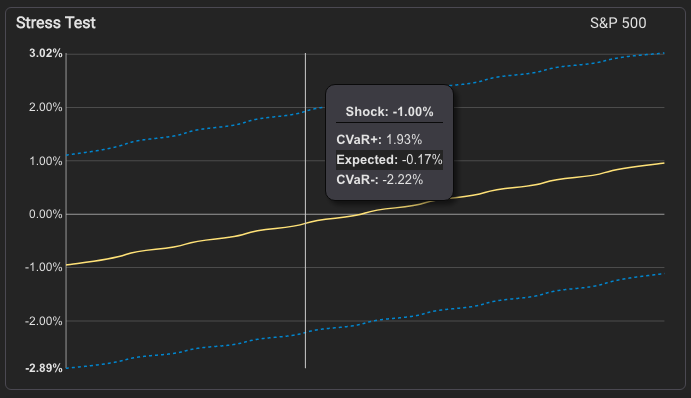
Tooltip
Moving the mouse over the chart shows the expected and tail P&L values at the corresponding shock magnitude on the x-axis.