Backtest
This widget plots the historical, pro-forma performance of the portfolio. It shows the total return that would have resulted from holding current positions from a point in the past (normally 3 years in the default templates) to today.
How It Works
The backtest uses split-adjusted closing prices for each security. If a security did not exist at the start date of the backtest, its equivalent dollar allocation is treated as cash. Foreign security values are converted to the portfolio's base currency each day using the prevailing FX rate.
For options, the delta equivalent is used in the pro-forma backtest. For bonds, the duration is used and historical key rates surrounding the duration are interpolated to re-price the bond.
When a portfolio Net Liquidating Value (NLV) is supplied, Everysk uses it as the initial invested value. When NLV is not supplied, a historical NLV is calculated from current securities and prices at the backtest start date. Because this historical NLV accounts only for cash securities, it may distort results for leveraged portfolios — in those cases, supplying an explicit NLV is recommended.
Widget Components
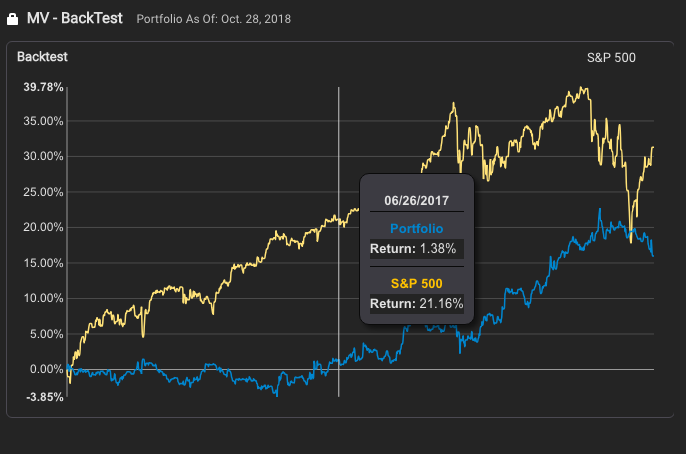
The chart displays two lines:
| Element | Description |
|---|---|
| Blue line | Portfolio total return |
| Yellow line | Benchmark index total return (default: S&P 500), shown when a benchmark is selected |
Tooltip
Moving the mouse over the chart shows a popup with:
| Field | Description |
|---|---|
| Date | The date being hovered over |
| Portfolio | Total return for the portfolio at that date |
| Index | Total return for the benchmark index at that date |