Datastore Parametric Stress Test
The Datastore Parametric Stress Test worker calculates portfolio behavior under various market scenarios to determine how a portfolio responds to extreme events and which securities benefit or detract in those scenarios.
Parameters
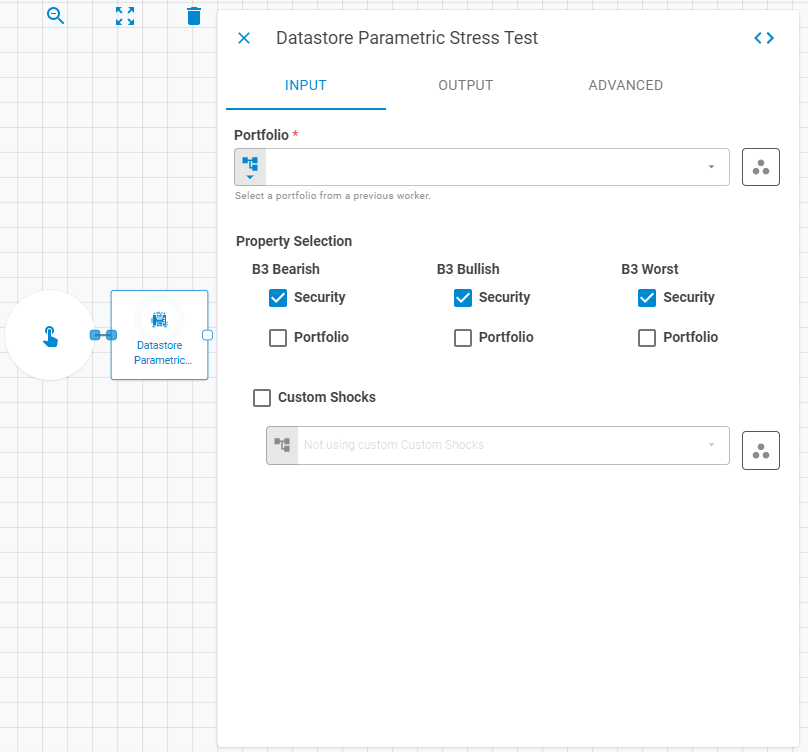
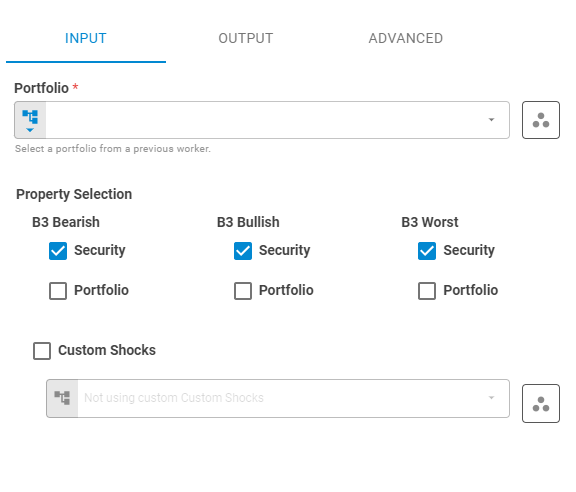
Input
| Field | Description |
|---|---|
| Portfolio | The target portfolio. Accepts Fixed Portfolio, Get Latest, or Upstream Data |
| Workspace | Workspace of the portfolio. Accepts Fixed Workspace. Defaults to the current workspace |
| B3 Bearish | Whether to calculate the B3 Bearish scenario at the Security and/or Portfolio level. Accepts Boolean |
| B3 Bullish | Whether to calculate the B3 Bullish scenario at the Security and/or Portfolio level. Accepts Boolean |
| B3 Worst | Whether to calculate the B3 Worst scenario at the Security and/or Portfolio level. Accepts Boolean |
| Custom Shocks | Datastore containing custom scenarios for expected portfolio behavior. Accepts Upstream Data, Fixed Datastore, or Get Latest |
Output
| Field | Description |
|---|---|
| Name | Name of the output datastore. Accepts Template Text or Upstream Data. Defaults to the portfolio name |
| Date | Date of the output datastore. Accepts Fixed Date or Upstream Data. Defaults to the portfolio date |
| Workspace | Workspace where the output datastore will be saved. Accepts Fixed Workspace. Defaults to the portfolio workspace |
| Tags | Tags for the output datastore. Accepts Fixed Tags or Upstream Data. Defaults to the portfolio tags |
| Storage Mode | Transient — exists only within the current workflow run (default); Create — saves the datastore to the platform |
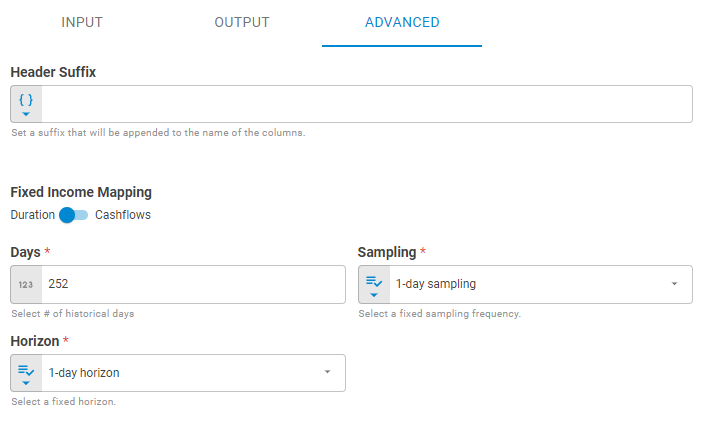
Advanced
| Field | Description |
|---|---|
| Header Suffix | Suffix appended to the end of property column names in the output datastore. Accepts Template Text or Upstream Data. Default is no suffix |
| Fixed Income Mapping | How fixed income securities are mapped to interest rate curves. Cashflows maps each cashflow event to key rate curve points; Duration uses Macaulay duration. Default is Duration |
| Days | Number of business days used to calculate the covariance for the primitive risk factors. Default is 252 |
| Sampling | Frequency at which historical prices and rates are sampled to compute risk factors. Use 1 for daily, 5 for weekly (non-overlapping). Default is 1 |
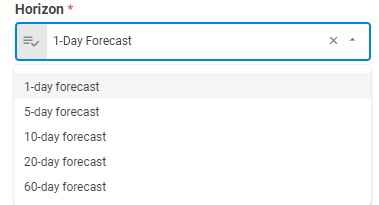
| Horizon | The forecast horizon for calculation. Produces a range of outcomes for each security via their underlying factors across a specific date range. Default is 1-day forecast |
Result
Once the worker finishes successfully, it returns a result object containing the datastore.
- Datastore (datastore)
- ID (string)
- Name (string)
- Date (date)
- Tags (list of strings)
- Data (list of lists)
The Data component includes the following columns:
port_parametric_st_bear_b3port_parametric_st_bull_b3port_parametric_st_worst_b3sec_parametric_st_bear_b3_*sec_parametric_st_bull_b3_*sec_parametric_st_worst_b3_*sec_parametric_st_custom_*