Reading Reports
Interpret the report visualizations
Each Report is comprised of one or more widgets. Widgets are responsive, dynamic visualizations that contain granular information about the portfolio risk/return characteristics.
In order to familiarize yourself with each widget, please refer to a detailed description in the following link: Widget List
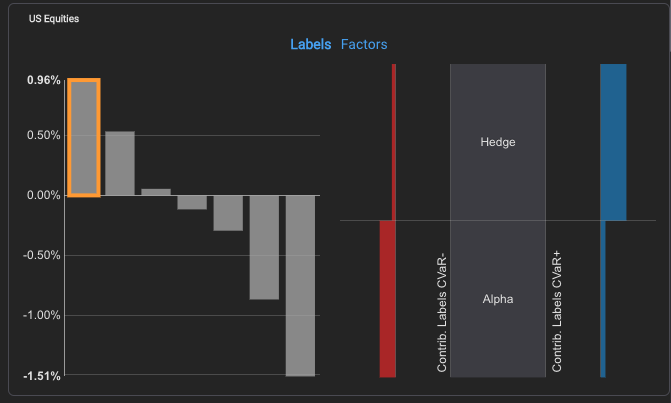
Example of a Widget for Stress Test
Make annotations on reports
In Reports tab, drag the Report from the left panel and drop it in the central panel. Then, in the right panel click over the "notes" icon:
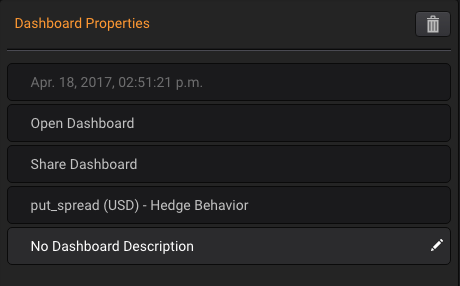
And write the annotation directly on the widget:
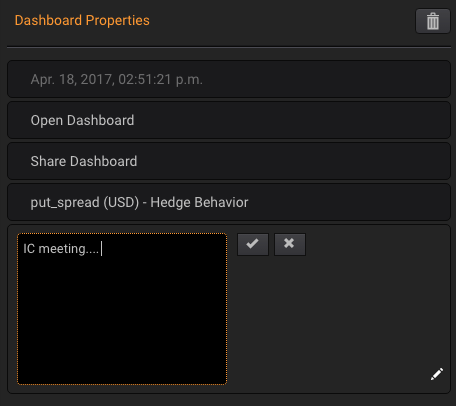
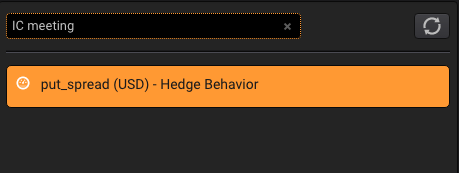
These annotations are useful to organize reports for future reference. Simply use the report search engine (located in the left panel) with any word from your annotation to filter specific reports from the list: